


4 Indicators to Identify the Bitcoin Top!
4 Indicators to Identify the Bitcoin Top!
Learn to quickly identify if Bitcoin is approaching a new all-time high or not.

Welcome to MrGekkoWallSt's virtual office! This is edition number 08 of my newsletter! Here, I organize and share my insights on the market, technical analysis, education, experiences, reflections, and the most relevant news of the period.
Reflection:
A long time ago, on the banks of the majestic Mississippi River, lived an old fisherman known for his unparalleled skill in predicting storms.
He didn't use sophisticated instruments like the meteorologists in the big city, but everyone was amazed by his knowledge and accuracy; his secret lay in careful observation of nature.
One day, while walking along the banks of the Mississippi, the old fisherman noticed a subtle change in the air. The wind was blowing differently, the leaves were dancing in a peculiar way, and the birds seemed restless.
These signs, completely visible yet ignored by many, were the hidden indicators he could appreciate and decipher.
From the top of a hill, the old fisherman watched the clouds slowly forming on the horizon. They were dark clouds, charged with electricity and promises of change.
He knew that if these clouds gathered enough, a powerful storm would descend upon the riverside region.
Just as the old fisherman read the signs of nature to anticipate a storm, cryptocurrency market investors have their own indicators.
They observe trading volumes, price behavior, investor sentiment, and chart patterns like someone reading the clouds in the sky.
Each sign, no matter how small, can be a harbinger of a significant event, such as a new all-time high in Bitcoin's price.
Moral of the story: Few people act like the old fisherman, which is why they fail to see and interpret the signs of what might be coming.
Today I will provide you with 4 indicators you can use to identify the approach of Bitcoin's new all-time high.
1 - Bitcoin: AASI (Active Address Sentiment Indicator)
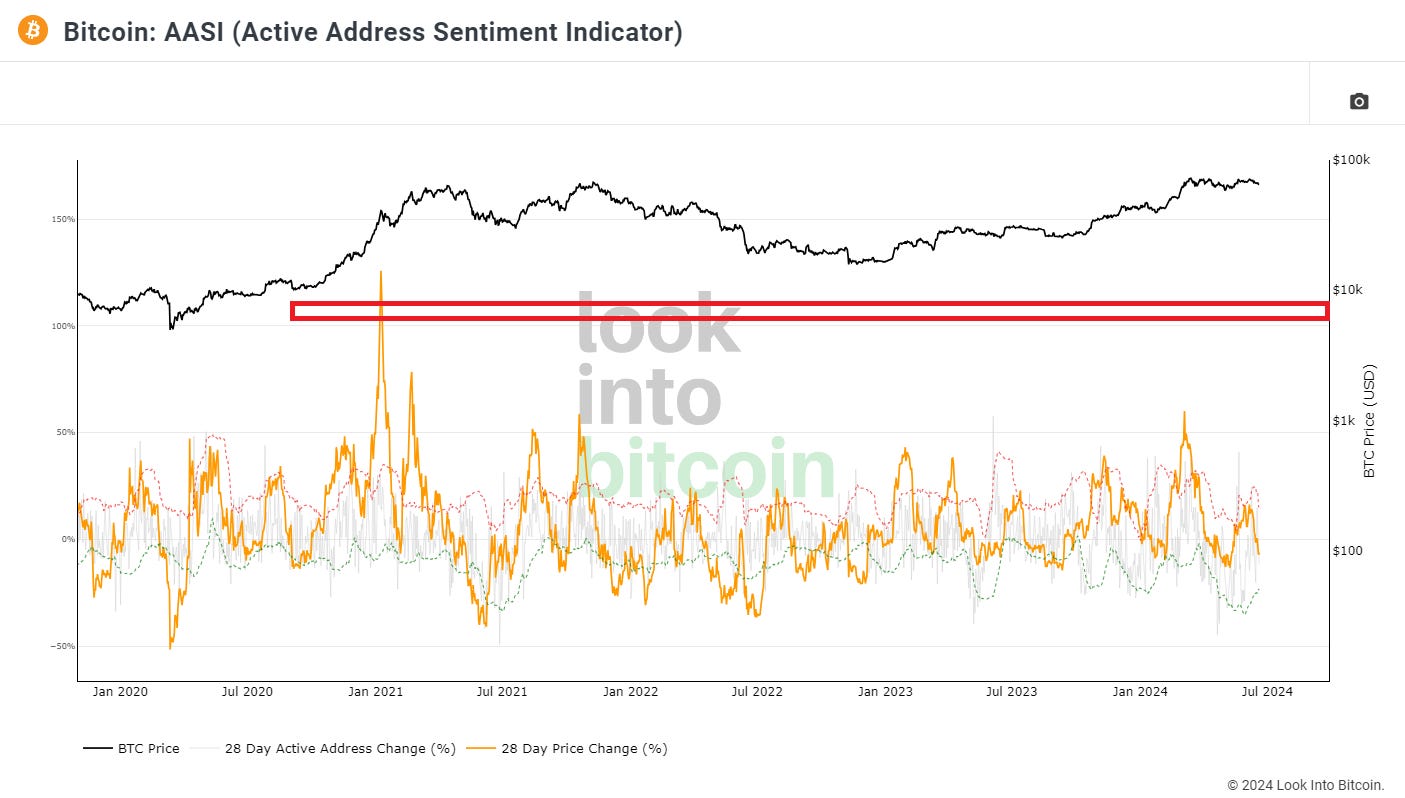
The indicator compares the 28-day price change (%) with the 28-day change in active Bitcoin addresses (%). The gray lines on the chart show the change in active addresses.
At the outer limits of these gray lines are standard deviation bands:
Dotted red line = upper limit.
Dotted green line = lower limit.
The orange line represents the 28-day price change (%).
When the orange line reaches the upper limit (dotted red line), it indicates that the short-term market sentiment is overheating because the rate of price increase is surpassing the rate of increase in active addresses.
MrGekko’s Tip: When this happens, the winds are stronger! Note that since 2021, the orange line has not exceeded the 100% target (left corner).
2 - Bitcoin: Net Unrealized Profit/Loss (NUPL)
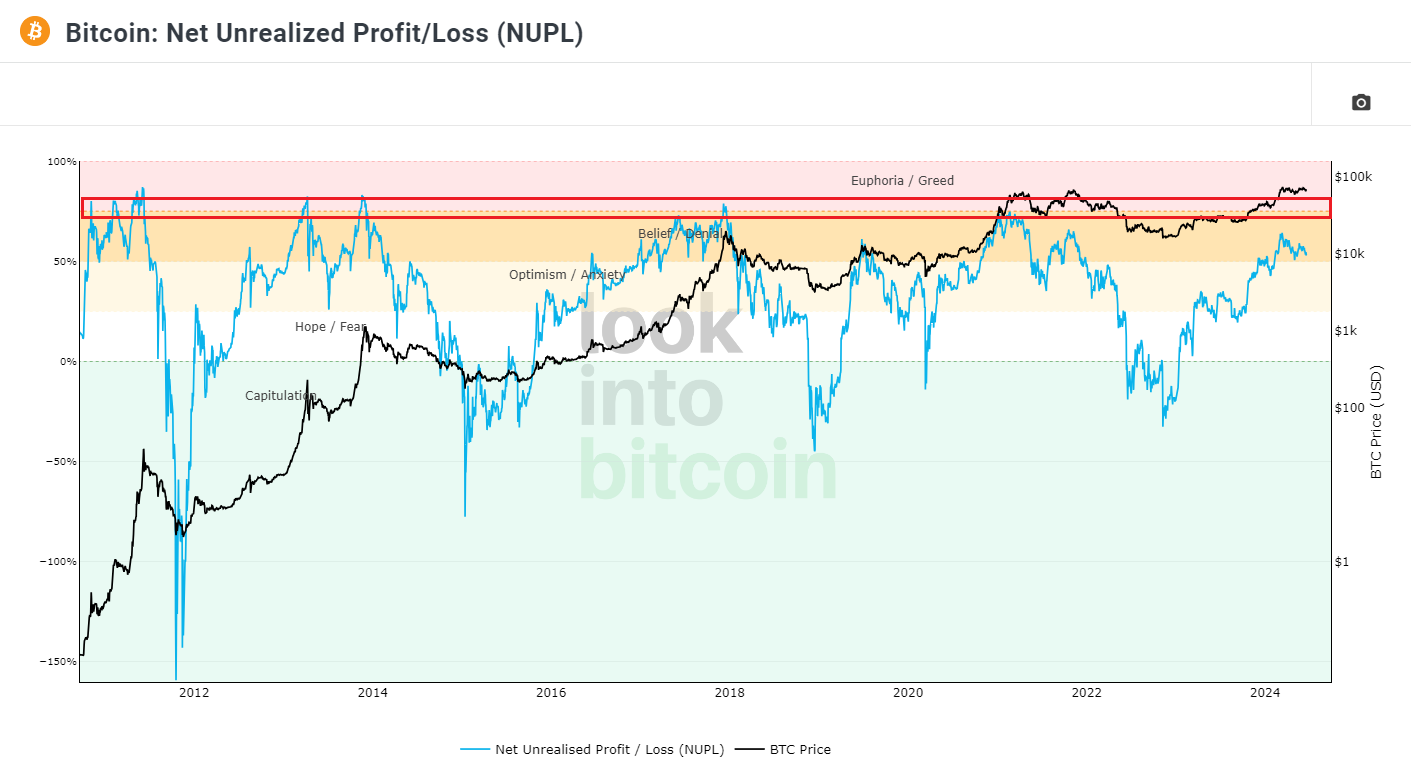
This indicator is derived from Market Value and Realized Value, which can be defined as:
Market Value: The current price of Bitcoin multiplied by the number of coins in circulation. This is similar to market value in traditional markets, i.e., the stock price multiplied by the number of shares.
Realized Value: Instead of calculating the current price of Bitcoin, Realized Value considers the price of each Bitcoin when it was last moved, i.e., the last time it was sent from one wallet to another. It then adds up all these individual prices and calculates an average of them. Next, it multiplies this average price by the total number of coins in circulation.
By subtracting the realized value from the market value, we calculate the unrealized profits/losses.
MrGekko’s Tip: When this happens, the birds get restless! Market capitalization increases much more rapidly than profit realization, indicating that the market is overheated. You could say this is due to investor greed (red zone).
3 - Bitcoin: Addresses with Balance > 1,000 BTC
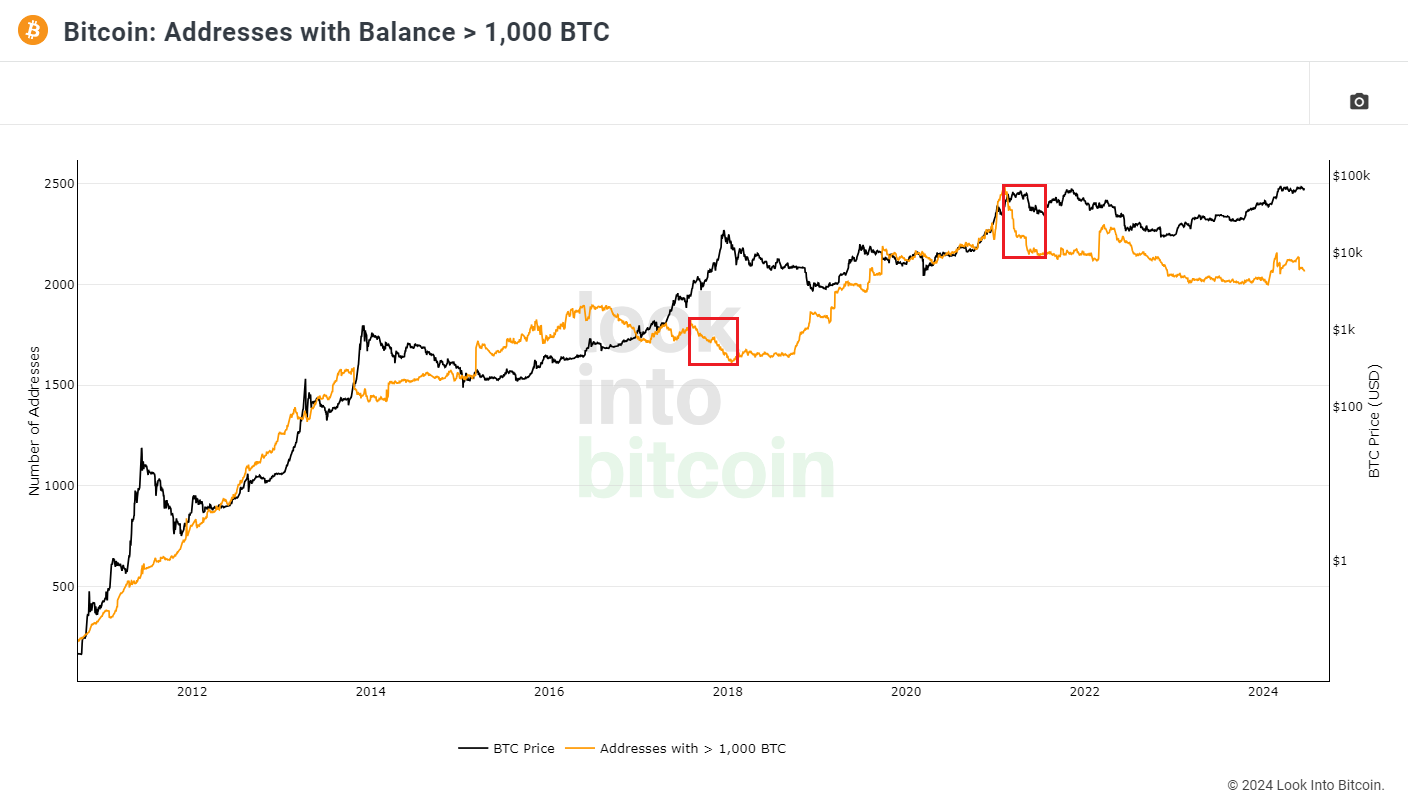
This indicator shows the number of unique addresses containing at least 1,000 BTC (orange line).
It can be used in conjunction with other address balance charts to understand whether adoption is generally increasing or decreasing for Bitcoin over time, and also whether usage is increasing or decreasing among groups with specific balances.
MrGekko’s Tip: The large and imposing bulls of the forest get scared when they see the birds stirring and seek refuge! The big market bulls don't go unnoticed; note that when the top was approaching in previous cycles, they were descending the mountain.
4 - Bitcoin: MVRV Z-Score
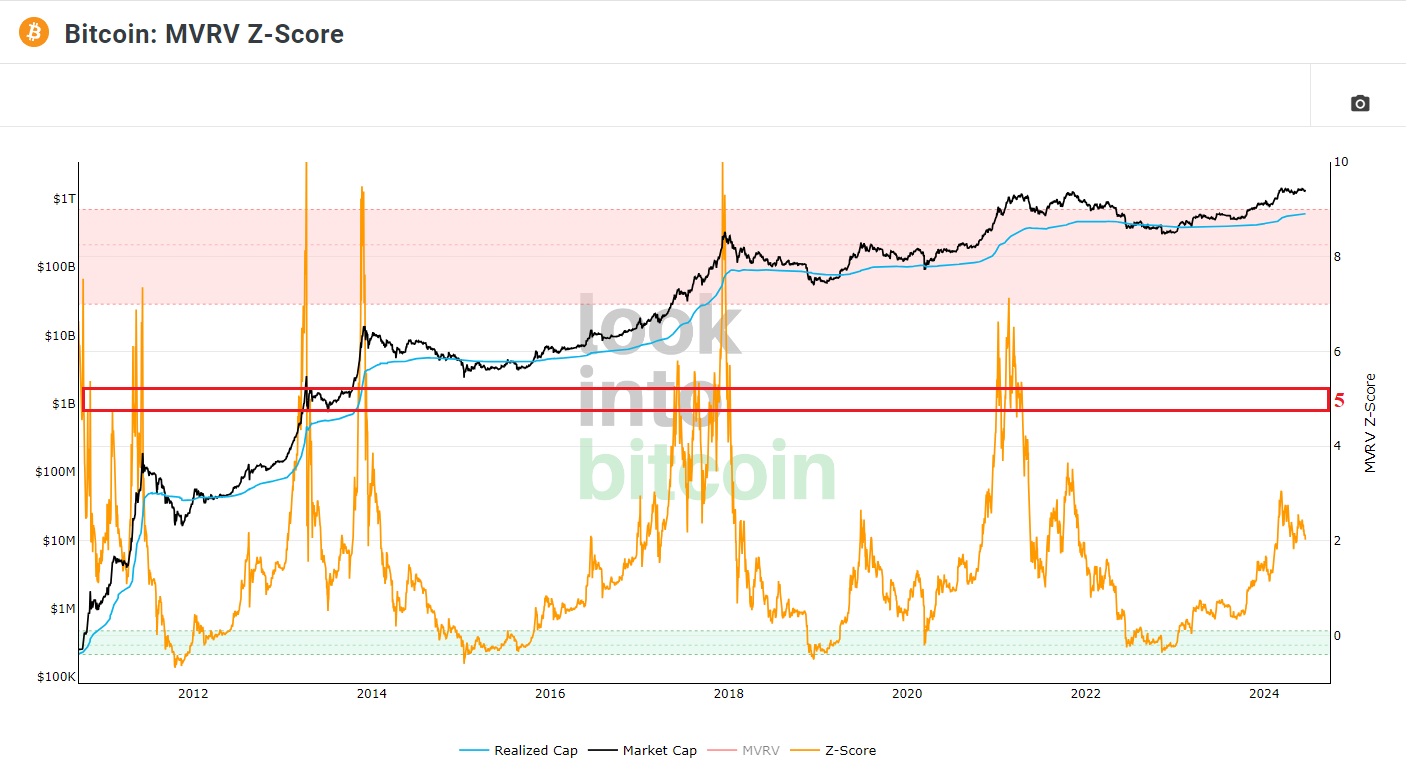
It is an indicator that uses blockchain analysis to identify periods when Bitcoin is extremely overvalued or undervalued relative to its "fair value."
It uses three metrics:
Market Value (black line): The current price of Bitcoin multiplied by the number of coins in circulation. This is akin to market capitalization in traditional markets, i.e., the stock price multiplied by the number of shares.
Realized Value (blue line): Instead of calculating the current price of Bitcoin, the Realized Value considers the price of each Bitcoin when it was last moved, meaning the last time it was sent from one wallet to another. It then sums all these individual prices and calculates an average. It then multiplies this average price by the total number of coins in circulation.
Z-Score (orange line): A standard deviation test that reveals the extremes of data between the market value and the realized value.
By doing this, it eliminates the short-term market sentiment present in the market value metric. Therefore, it can be seen as a more “true” measure of Bitcoin's long-term value, whose market value moves above and below depending on market sentiment at the time.
MrGekko's Tip: It's the moment when the first drops of the storm start to fall! On the score to the right, note that the first warning signal appears from the halfway point (level 5).
Final Thoughts:
Don’t look for miracle indicators, they don’t exist. In the current market phase, many investors are already becoming desperate and speculating about an end of the cycle that doesn’t make sense.
Learn to value widely known or easily accessible indicators because, most of the time, it’s the simple things that work. The search for miracles makes most people believe in complex indicators, as if there were hidden secrets to hitting the top.
In the analogy of the bulletin, the fisherman identifies the arrival of rain through a sequence of events and not just by an isolated fact.
In other words, when gathering good indicators, acquire the ability to define an objective idea based on probabilities and don’t wait for the storm to come to you, leave before it destroys you.

Relevant News:
SEC drops Ethereum investigation to avoid ‘embarrassing’ court case
Kraken-CertiK saga turns murky as part of exploited funds go ‘missing’
German government moves $195 million worth of Bitcoin to exchanges
Standard Chartered to Launch Spot Bitcoin & Ethereum Trading Desk
Mt. Gox trustee to start Bitcoin, Bitcoin Cash repayments in July
Disclaimer:
This is a newsletter where I publish my unbiased analyses and considerations that should not be taken as advice or recommendations. I do not provide financial recommendations for buying, selling, or holding assets, and I do not promise quick wealth. You should conduct your own analysis and decision-making. I believe that knowledge is the key to the financial market, and I am committed to sharing insights that can help you see the market from different angles.
If you're not already following this newsletter, consider subscribing. Every week, I share my analyses, experiences, and the most relevant news of the week. Let's investigate the fundamentals, charts, and gather the most valuable insights from the financial market!