Bulls in the S&P 500 may surprise until the end of 2023
The dollar is sending signals that it could melt down and boost the market. Comprehensive analysis on liquidity, volatility, and much more.
Welcome to MrGekkoWallSt's virtual office!
This is edition number 03 of my newsletter! Here, I organize and share my insights on the market, technical analysis, education, experiences, reflections, and the most relevant news of the period.
In this week's analysis, I will address:
A deeper dive into the S&P500 index and some probabilities until the end of 2023.
What the S&P500 volatility index (VIX) may be indicating in terms of risk.
Current liquidity conditions through the analysis of the Dollar Index (DXY) and the Federal Reserve's Overnight Reverse Repurchase Agreements (RRP) account.
Bitcoin's behavior after the FOMC meeting, which decided to keep interest rates within the range of 5.25% to 5.50%.
S&P500 Index
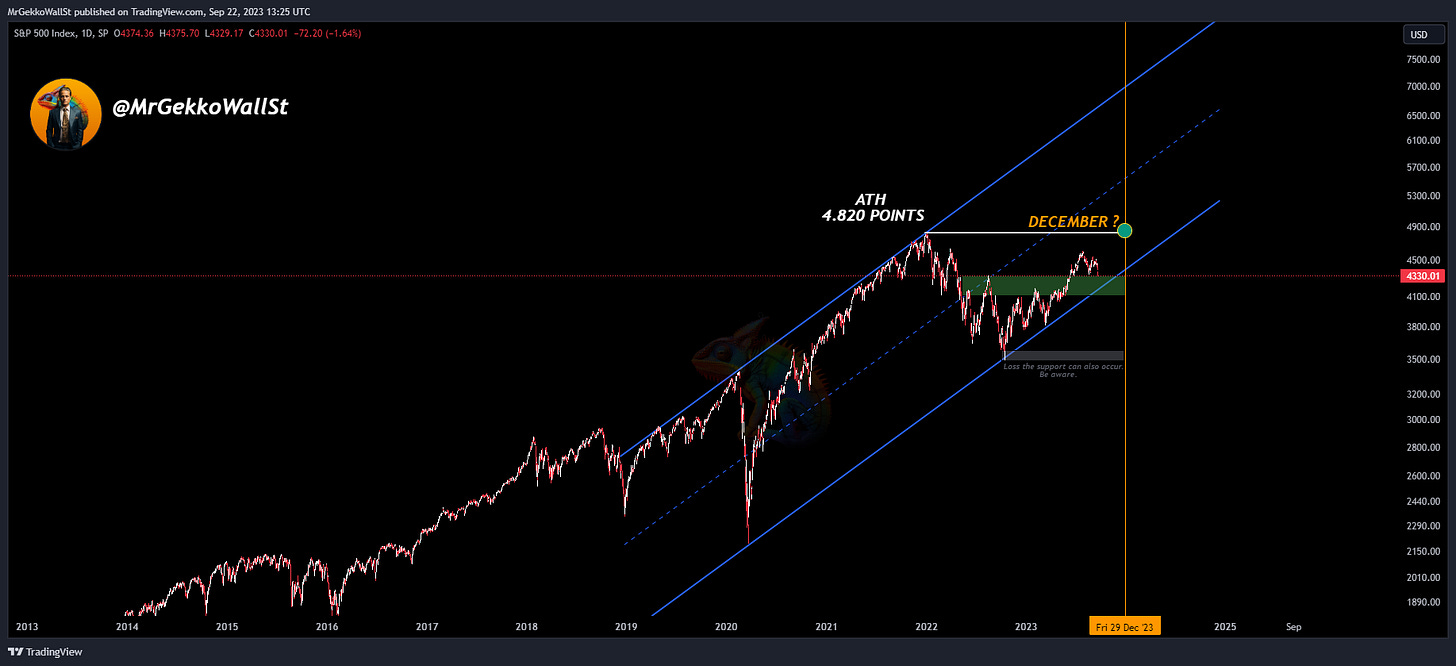
In the 1st edition, I provided some seasonal statistics that highlight good odds for the S&P 500 to reach its All-Time-High (ATH) by December 2023 or at least move in that direction in the coming months.
Historically, September is a month known for significant declines or low volatility. This time is no different, even though there are still a few days left in the month.
If the most optimistic scenario unfolds, it is expected that the index will find support between the green region and the bottom of the long-term uptrend channel in blue.
After consolidating, a bullish resurgence could occur in the aggregate for the last 3 months of the year, heading towards the white line (historical peak).
In this analysis I posted on TradingView on August 29th, you can get a better view and understand how this bearish structure has evolved since then: https://www.tradingview.com/chart/SPX/nadGqxcW-S-P500-in-the-short-term-is-bearish/
VIX MONTHLY
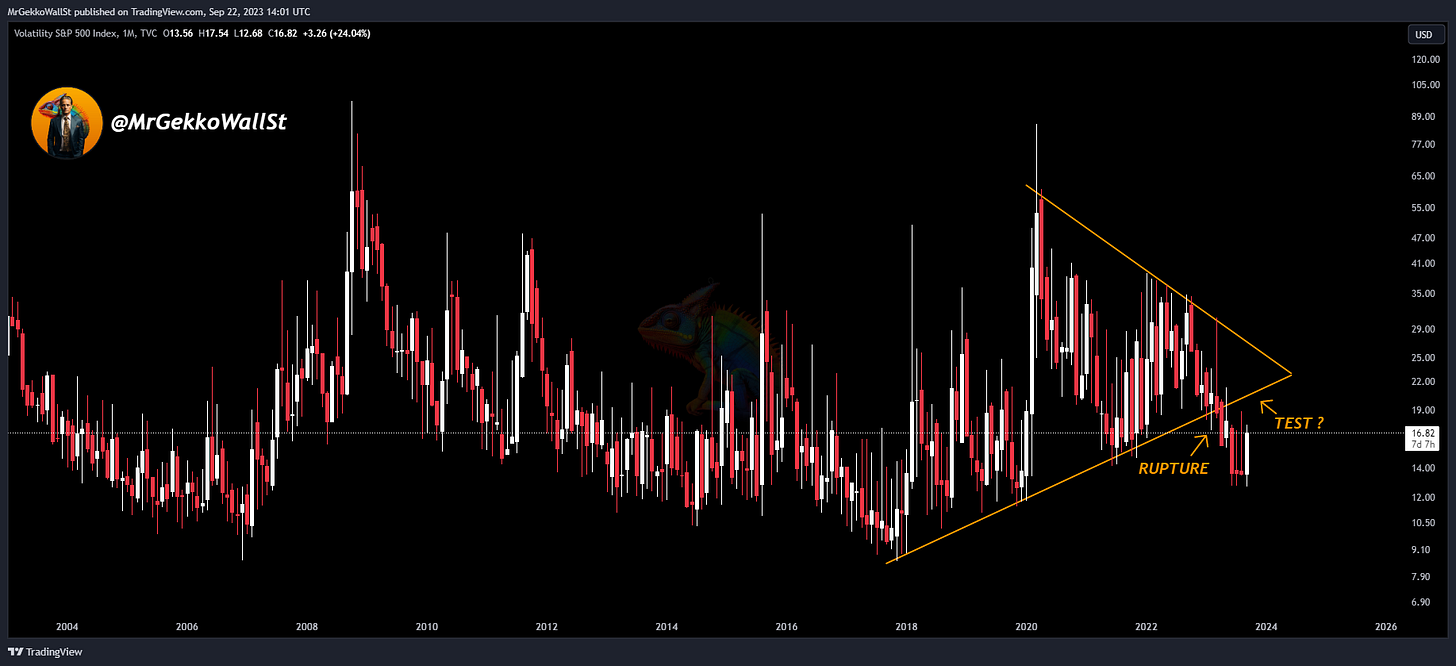
VIX is the ticker symbol and popular name for the CBOE Volatility Index of the Chicago Board Options Exchange, which measures the expectation of market volatility based on S&P 500 index options. It's calculated and real-time disclosed by the CBOE and is often referred to as the "fear index" or "fear gauge."
The highest spikes in volatility occur during periods of significant financial market stress. For instance, observe how VIX behaved at the beginning of 2020 during the COVID-19 health crisis.
Between March and April of 2023, there was a break in the uptrend line that had been intact since 2018. In recent months, the index seems to be attempting a return to this trend line.
If this return occurs, the most optimistic scenario would be a rejection at this level to keep VIX in a sideways or downward trend.
Dollar Index (DXY)
The DXY is one of the most important indicators of liquidity, as the US dollar is the most widely used commercial currency.
When economic uncertainty rises, people sell risky assets and turn primarily to the dollar as a safe asset.
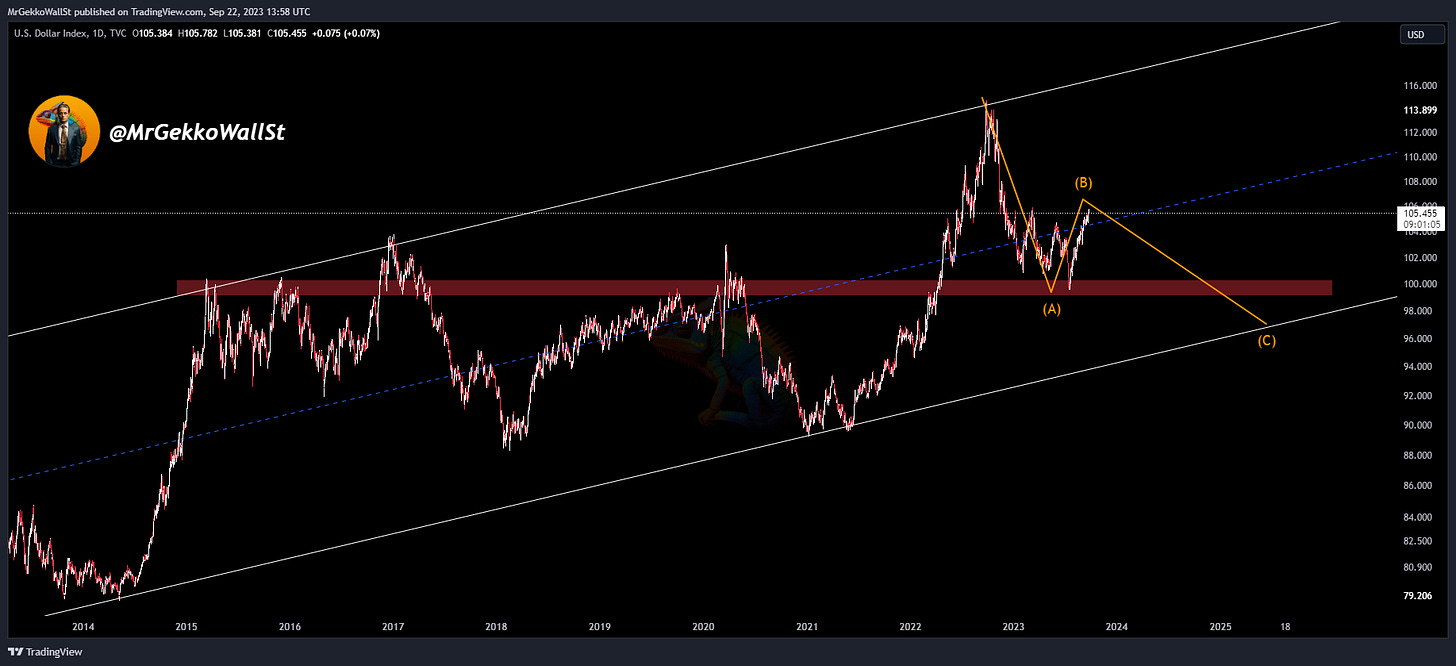
Between the middle of 2021 and most of 2022, the momentum from the bottom to the top of the long-term channel clearly illustrated this risk aversion dynamic.
From then on, a decline began, and liquidity started flowing back into the market.
Apparently, the index reached a turning point at (B). Currently, there are many people expecting the index to continue rising, which would harm risk assets like stocks and cryptocurrencies.
This negativity could be one of the significant factors for the downward trend in the index to intensify.
Therefore, one of the scenarios I am keeping an eye on is the one in the image below, of a hypothetical ABC correction. The focus should be on the direction of the movement and not on targets or timelines.
Overnight Reverse Repurchase Agreements (RRP)
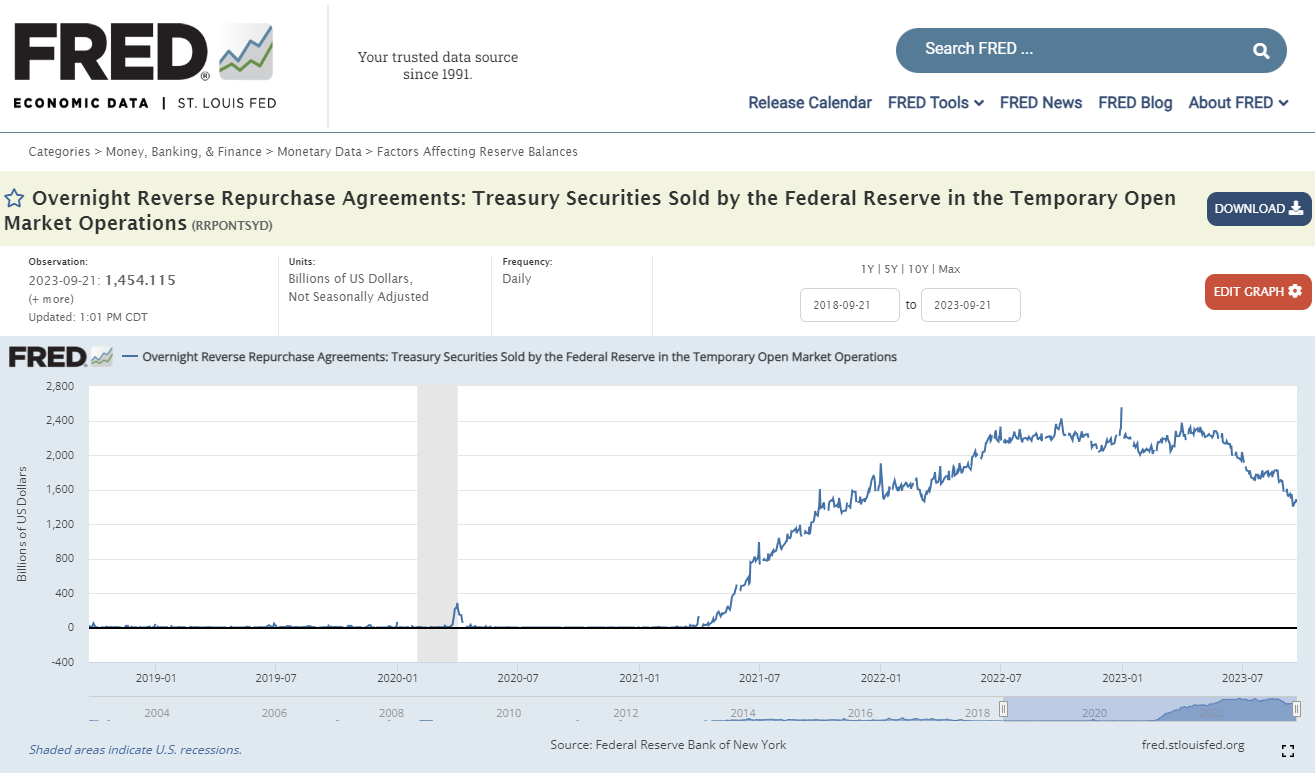
Also known as "reverse repo," RRPs remove reserves from the system. Banks lend money to the Fed and receive securities as collateral for the loan, plus interest. If the Federal Funds Rate (the target range for the interest rate set by the Fed) falls too low, banks can use RRP to get a better rate for their money.
From June 2022 to the present, we can observe that there has been a withdrawal from the Fed's account. Nearly 1 trillion dollars have returned to the system during this period.
Bitcoin
In this scenario, Bitcoin continues its consolidation, awaiting a stronger signal of risk appetite, primarily coming from the American indices.
It's important to emphasize that Bitcoin probably won't follow the same pattern as from 2013 to 2017.
Don't count on it. What matters to us is the direction. There are many other tools that are more efficient at identifying the stages of a bull cycle than fractals. Keep following my newsletter regularly so you don't miss any of them.
Final Thoughts:
Certainly, the market is at a crucial juncture. In recent months, overnight Reverse Repurchase Operations (RRP) withdrawals may be significantly contributing to the recovery of the traditional market.
It's important to note that this relationship isn't directly proportional, as there is a delay between the withdrawals and the impact on the S&P500 index, among others.
Looking ahead to the next few weeks, if these RRP withdrawals continue and the dollar index also faces resistance around the 106,000 points mark, the probability of an uptrend in risk assets will increase.
Therefore, the prospect of a scenario with increased liquidity and risk appetite would become more reasonable for the last quarter of the year. However, it's crucial to keep an eye on the monthly closing of the S&P500 to respond to adverse scenarios.
This is my analysis for today.
Be sure to subscribe to receive the upcoming edition number 04 soon.
Some topics I will address include:
Another round of analysis on Bitcoin ETF applications coming up, according to the SEC.
Bitcoin and historical statistics to watch for the rest of the year.
An expanded view on the total market capitalization of altcoins.
Investor sentiment analysis.
Relevant News:
Macro Economy:
Joe Biden addresses UN on international AI regulation: ‘It’s going to take all of us’
Dollar hits 10-month high as US yields spike, yen recovers from dip
Cryptocurrencies:
TON Foundation Partners Chainbase and Tencent Cloud to Foster Blockchain Development in Asia-Pacific
MicroStrategy buys $147M worth of Bitcoin, now holds 158K BTC
Disclaimer: This is a newsletter where I publish my unbiased analyses and thoughts that should not be taken as advice or recommendation. I do not provide financial recommendations for buying, selling, or holding assets, and I do not promise quick wealth. You should conduct your own analysis and decision-making. I believe that knowledge is the key to the financial market, and I am committed to sharing insights that may help you see the market from different angles. If you're not already following this newsletter, consider subscribing. Every week, I share my analyses, experiences, and the most relevant news of the week. Let's investigate the fundamentals, charts, and gain the most valuable insights from the financial market!


